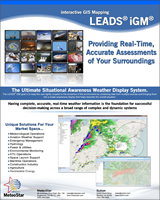
LEADS® iGM® - The Ultimate Situational Awareness Weather Display Tool
MeteoStar’s newest addition to our product line, LEADS® On-Line Interactive GIS Map (iGM®), is a complete web-based situational awareness display that allows the integration of not only standard hydro-meteorological data sets, but customer unique data as well. As LEADS® iGM® is a web-based display, allowing for access not only from multiple internal locations, but can also to your customer base with a simple internet connection.
Data Integration
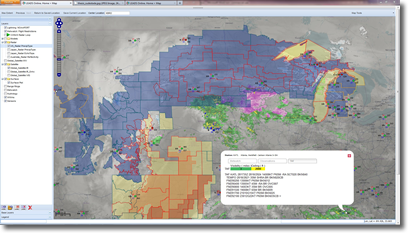 Due to the flexibility built into the LEADS® iGM® infrastructure, we are able to make available almost all data types that can be currently displayed in the hydro-meteorological
community today. Each data type is displayed as a layer that can be turned on/off as necessary and new layers can be easily added via our extensive layer library catalog.
Due to the flexibility built into the LEADS® iGM® infrastructure, we are able to make available almost all data types that can be currently displayed in the hydro-meteorological
community today. Each data type is displayed as a layer that can be turned on/off as necessary and new layers can be easily added via our extensive layer library catalog.
Custom Data Integration
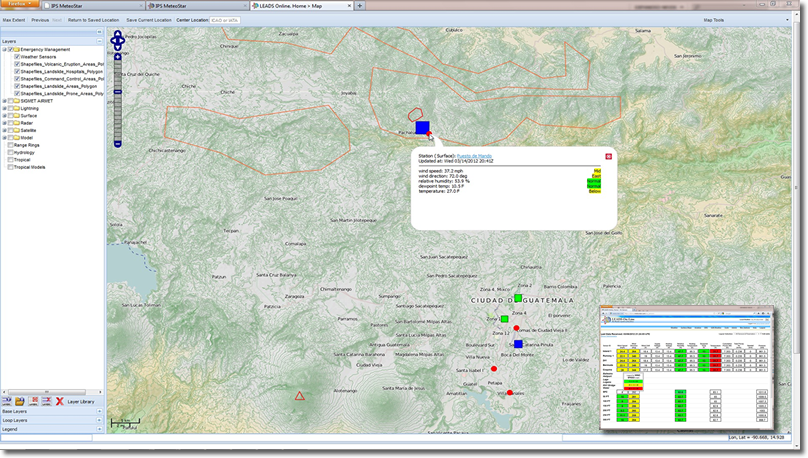
LEADS® iGM® is not just limited to hydro-meteorological data sets. We can easily integrate customer specific data into LEADS® iGM®. Through the power of LEADS®, user data such as meteorological/hydrological sensors and customer assets can easily be placed on the iGM maps and be monitored for changing conditions. Due to our unique architecture design, LEADS® iGM® can display any type of sensors in real-time with no lag in updating displays and alert triggers
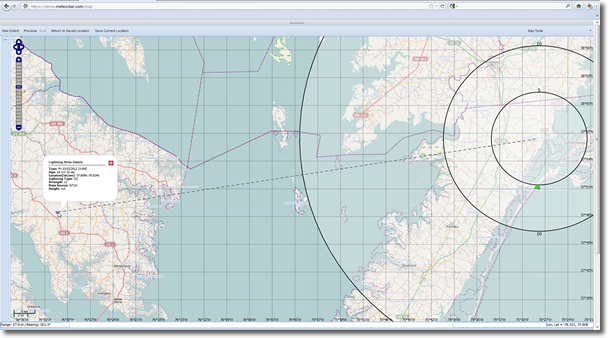
Tools & Functionality
Tools and functions are constantly being added to the LEADS® iGM® to make the interface more intuitive and easy to use. These features vary from Range Rings/Bearing & Distance overlays to point-and-click model data extraction. Many data types include point-and-click functionality to display the bulletins and alerts in popup windows.
Alerting
Custom alerting has been built into the LEADS® iGM® framework and has been uniquely tailored so that the user can be made aware of rapidly changing conditions. Based on user defined parameters and value threshold, color coding of map displays can be applied so that threshold changes are easily viewable on the map. Users may drill down to further investigate a specific sensor to see trends and forecasts.